Most Polluted Countries in the World (2026 Rankings)
Pakistan, Bangladesh, Chad, and the DR Congo top the world's most polluted countries, with fine-particle levels over 10 times the WHO limit. See the 2026 picture.
Published
Key takeaways
- South Asia, Central Africa, and the Middle East dominate the rankings. Pakistan, Bangladesh, Tajikistan, Chad, the DR Congo, and India have the world's highest average fine-particle pollution, roughly 10 to 13 times the safe limit.
- Almost nobody breathes clean air. The WHO estimates 99% of the world's population lives with air that exceeds its guideline, and only a handful of mostly island nations meet the standard.
- The rankings are built on PM2.5, fine particles. These specks lodge deep in the lungs and pass into the bloodstream, which is why they, not the smog you can see, define the most polluted list.
- In these cities the pollution comes mostly from burning things. Traffic, coal and industry, household cooking and heating fires, and seasonal crop burning drive the worst urban air, with desert dust adding to it in parts of Africa and the Middle East.
- A national average hides your actual air. Pollution swings by the hour, the season, and the street, so a live local reading tells you far more than a country's yearly number.
The world’s most polluted countries are concentrated in South Asia, Central Africa, and the Middle East. In the most recent global rankings, Pakistan and Bangladesh top the list, followed by Tajikistan, Chad, and the Democratic Republic of the Congo, each with average fine-particle pollution more than ten times the World Health Organization’s safe limit. The bigger picture is bleaker than any single leaderboard: the WHO estimates that 99% of the world’s population breathes air that fails its guidelines. Here is who tops the list, and why.
Which are the most polluted countries in the world?
The standard way to rank countries is by their average level of PM2.5, the fine particle pollution that does the most harm to health. By that measure, the annual World Air Quality Report, which compiles readings from thousands of monitoring stations, puts these countries at the top in its latest edition.
| Rank | Country | Annual PM2.5 (µg/m³) | vs. WHO limit |
|---|---|---|---|
| 1 | Pakistan | 67.3 | ~13x |
| 2 | Bangladesh | 66.1 | ~13x |
| 3 | Tajikistan | 57.3 | ~11x |
| 4 | Chad | 53.6 | ~11x |
| 5 | DR Congo | 50.2 | ~10x |
| 6 | India | 48.9 | ~10x |
| 7 | Kuwait | 45.7 | ~9x |
| 8 | Uganda | 43.0 | ~9x |
| 9 | Egypt | 40.6 | ~8x |
| 10 | Uzbekistan | 38.1 | ~8x |
The contrast at the other end is stark. Of the 143 countries and territories measured, only a handful met the WHO’s annual guideline of 5 micrograms per cubic meter, nearly all of them small islands such as French Polynesia, Barbados, and Iceland, helped by ocean winds and almost no heavy industry. For everyone else, clean air is the exception.
Why is South Asia the epicenter of air pollution?
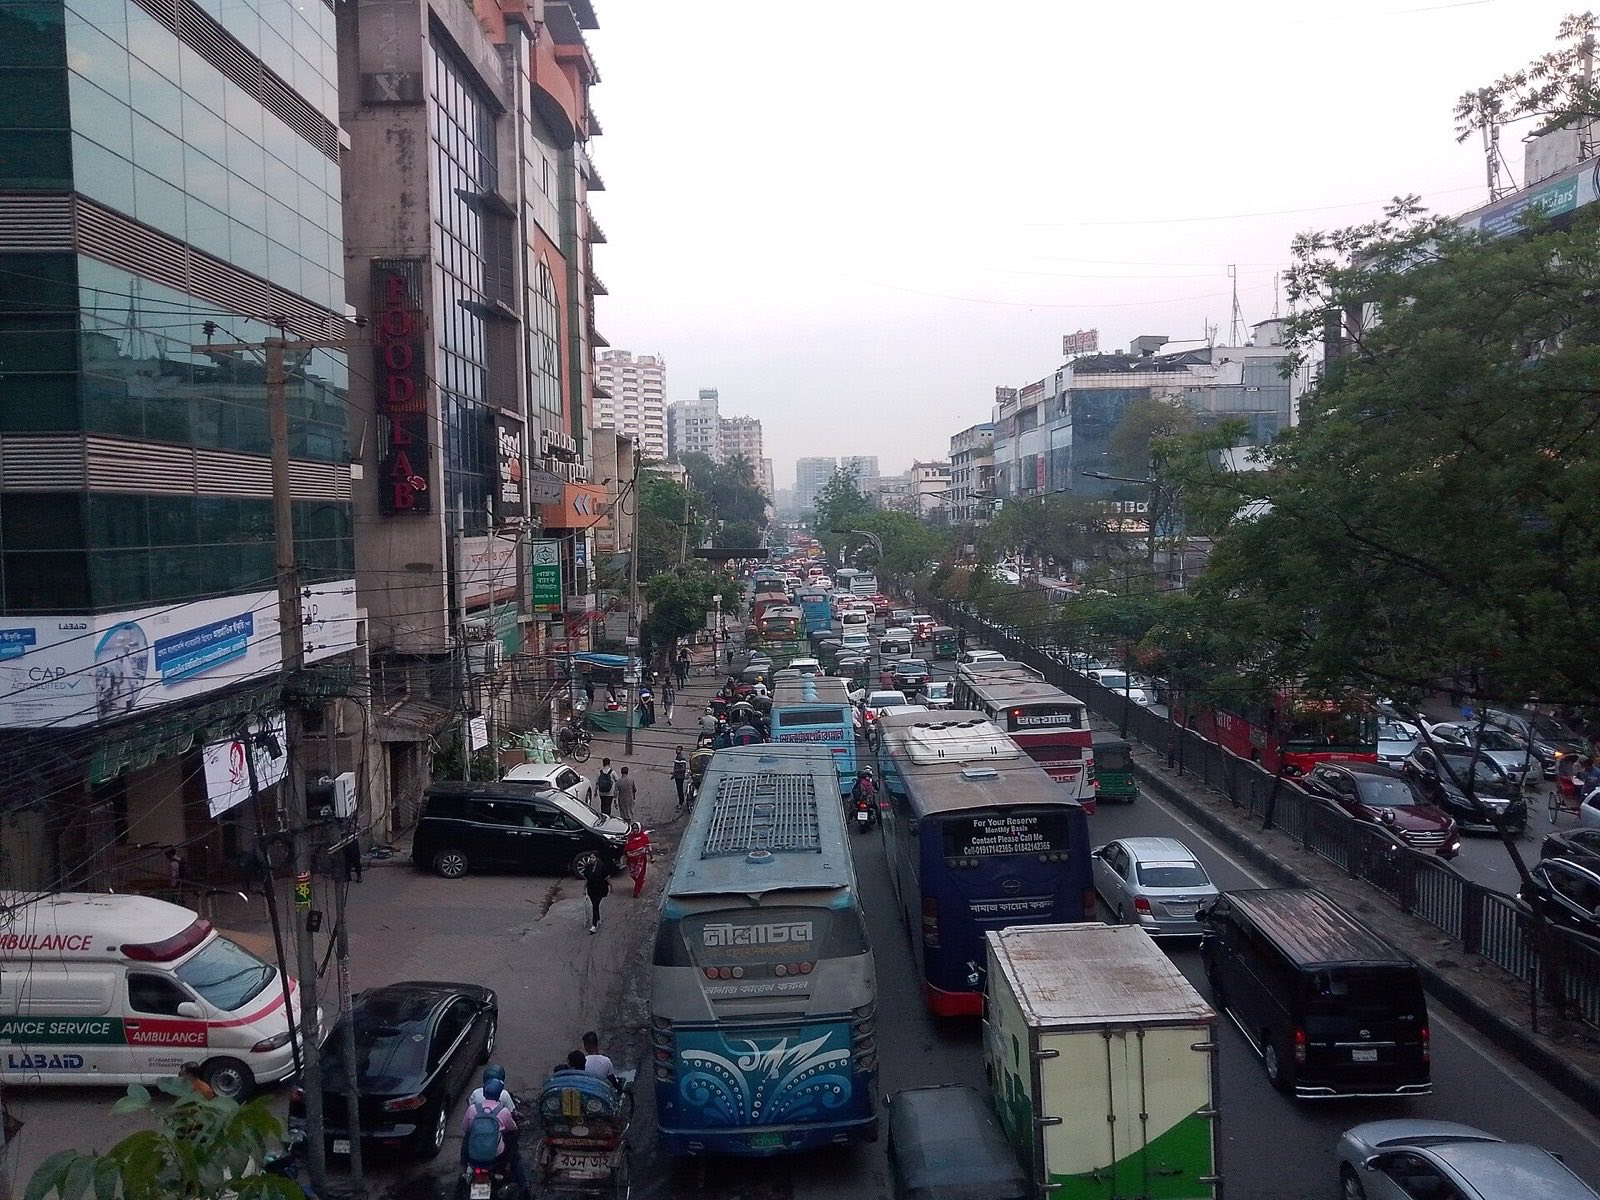
South Asia is in a league of its own. Pakistan, Bangladesh, and India rank first, second, and sixth as countries, and cities across those three plus Nepal fill the large majority of the world’s 100 most polluted urban areas. The Health Effects Institute, which produces the State of Global Air report, finds the highest fine-particle exposures anywhere are in Asia, Africa, and the Middle East, and they have stayed persistently high across South Asia.
Two forces stack up there. A dense concentration of pollution sources, including traffic, coal power, heavy industry, and household cooking and heating fires, runs year round. Then in the cool months, widespread crop-residue burning combines with still, stagnant air that traps the smoke close to the ground, which is why northern India and Pakistan see their worst readings in autumn and winter.
Which pollutant makes these cities the most polluted?
Almost every global ranking is built on a single pollutant: PM2.5, particles smaller than 2.5 microns across, a tiny fraction of the width of a human hair. They earn that starring role for two reasons. First, they are the most dangerous. The WHO notes that PM2.5 penetrates deep into the lungs and passes into the bloodstream, driving heart disease, stroke, and respiratory illness. Second, they are measured consistently around the world, which makes them the fairest yardstick for comparing one country to another.
So what is actually in the air of the most polluted cities? Overwhelmingly, it is the fine soot and particles thrown off by burning things: vehicle exhaust, coal-fired power and industry, and millions of household fires used for cooking and heat, with seasonal crop burning and, in places like Chad and the Sahel, wind-blown desert dust adding to the load. The gases that also feed an air quality reading, such as ozone and nitrogen dioxide, each play their own part, but that is a subject for its own guide. For what the AQI number itself means band by band, see our AQI scale guide.
Do these rankings tell you about your own air?
Only loosely, and that is the catch. A national or even city figure is a single yearly average, but real air quality swings enormously by the hour, the season, and even the street. A city with a bad annual number can have clean mornings and hazardous evenings, and a “clean” country can have a smoky week during a wildfire. The country you live in sets the backdrop; it does not tell you whether to go for a run today.
That is the gap a live local reading fills. Our guide on how to check air quality walks through the options, and Skyvo is built for exactly this: it shows your local air quality on the US or European scale, forecasts it hour by hour, and puts it next to the UV index, so you know your real exposure right now instead of a country’s yearly average. Because the same air can read differently depending on the scale, our US vs. European index guide explains why.
The trend underneath the rankings
The leaderboard is a useful wake-up call, and the story beneath it is not all bad. The Health Effects Institute notes that South Asia’s worst-hit countries have started to see modest improvements, even as parts of sub-Saharan Africa move the wrong way. The gap between the dirtiest and cleanest air on Earth is enormous, and where you live still shapes how much pollution you breathe over a lifetime.
But the number that matters most on any given day is your own, right now. Wherever you land on the global map, checking your local air before you head outside is the habit Skyvo is designed to make automatic.
Frequently asked questions
What is the most polluted country in the world?
By annual average fine-particle (PM2.5) pollution, Pakistan and Bangladesh top the most recent world rankings, followed by Tajikistan, Chad, and the Democratic Republic of the Congo. All of them sit around 10 to 13 times above the World Health Organization's safe limit of 5 micrograms per cubic meter.
Why is South Asia so polluted?
A dense mix of traffic, coal power, heavy industry, and household cooking fires pumps out fine particles year round, and in the cool months crop-residue burning plus still, stagnant air trap the smoke near the ground. That is why cities across Pakistan, India, Bangladesh, and Nepal fill most of the world's 100 most polluted list.
What pollutant makes a city the most polluted?
Global rankings are based on PM2.5, the fine particles under 2.5 microns wide that come mainly from burning fuel. They matter most because they penetrate deep into the lungs and bloodstream, and because they are measured consistently worldwide, which makes them the fairest way to compare places.
Which countries have the cleanest air?
Only a small number of countries and territories meet the WHO annual guideline, and they tend to be islands or cool, sparsely populated places such as French Polynesia, Barbados, and Iceland, helped by ocean winds and low industry. Most of the world, rich and poor, still breathes air above the guideline.
Sources
Get Skyvo on your phone
Track the UV index and air quality wherever you are. Free on iPhone and Android.


Related reading
AQI Scale Explained: What Is a Good Air Quality Index?
The AQI runs 0 to 500 across six color-coded bands. 0 to 50 (green) is good air, and 101 or higher means sensitive groups should start adjusting outdoor plans.
How to Check Air Quality Near You in 2026 (5 Ways)
Check air quality near you with AirNow or Europe's EAQI, a PurpleAir sensor map, the World Air Quality Index map, your phone's weather app, or a dedicated app.
US AQI vs. EU Air Quality Index: What's the Difference?
The US AQI is a 0 to 500 number covering six pollutants; the European index is a named band from Good to Extremely poor covering five. Same air, different labels.
Ozone, NO2, PM2.5, PM10: The Pollutants Behind Your AQI
The pollutants behind your AQI are ozone, nitrogen dioxide, sulfur dioxide, carbon monoxide, and fine and coarse particles. Where each comes from and why.